
30th December 2000
Geneva / Switzerland
|
Global Peoples' Convention
30th December 2000 Geneva / Switzerland |
|
|
World Parliament: The "Numbers Game"Actually, the question of global representation is not a game. Quite to the contrary: like in any modern-day democracy, it is one of the most important and far-reaching decisions that has to be taken when weighing the relative "voice" given to each individual person, country, region, continent. When one tries to work out a balanced distribution of global representation, however, the task quickly turns into a never-ending "game" of compromises and alternatives. In 1950, The People's World Convention was conceived as an assembly of national delegations elected on the basis of "one delegate per one million inhabitants". Today, with over 6 billion people living in the world, this would add up to a mammoth parliament of over 6000 delegates! This wouldn't work. Worse still: more than fifty percent of the delegates would come from the ten most populous countries alone - nothing that we would consider very democratic or representative nowadays. On the other hand, it' s also quite inconceivable to grant the same number of delegates to each modern nation-state, irrespective of the size of its population: nobody would dream of putting the relative strength of, say, the Chinese population, on an equal footing with dozens of tiny island-states. What about the question of territorial size: does it have to be taken into consideration as well? And what about economic and/or military strength: are some mighty countries going to accept an equal representation with some "underdeveloped" poor nations? Even before going into such tricky details, a crucial question will be the overall size of a functional World Parliament: how big can a group of people be and still debate and parley in a reasonable, sensible fashion? To take a few examples of today's biggest working National Parliaments, or "Lower Houses": in the United Kingdom there are 659 MP's, in Germany 656, in Italy 630. So, for all practical purposes, and judging from these modern-day examples, around 700 Members of Parliament would be about the upper limit of what a World Parliament-to-be should consist of. One way of getting closer to a balanced global representation is the so-called Penrose Square-Root Method: You take the number of a country's population in millions - and its square-root gives you the number of representatives that country is entitled to. Based on the national population figures (taken from Wikipedia "List of countries by population" as per May 2010), this method would add up to a total of 744 representatives - or, when allowing for the smallest countries to be represented by at least one representative, to 763. There would still result a certain number of inequalities - this time stemming from the fact that regions with a large number of countries (irrespective of their overall population) are over-represented in comparison to regions with only a few countries. For example, Sub-Saharan Africa, with 48 nations and some 830 MIO people, would have twice as many representatives as the whole Indian sub-continent, which consists of only 8 nations but has an overall population of well over one billion people. For the same reason, China and the U.S.A. would be grossly under-represented. To smoothen out this new inequality, all the present nation-states could be grouped into nine more or less homogeneous World Regions (homogeneous in respect to their common culture, history, religion, and geographical affinity) - with each of the World Regions having right to 81 representatives in total. (As to this "weighted" allocation of seats per nation, see attached calculation.) The nine regions in turn could then be grouped into three World Groups (with a total of 243 representatives each) - with each World Group acting as a voting block within the World Parliament (see attached voting example). The nine Regions and three Groups could be the following: |
|
1. Eastern European Region |
Group "East" |
|
4. Western European Region |
Group "West" |
|
7. Sub-Saharan
Region |
Group "South" |
Each Group, and each Region, would have the same number of delegates, and thus equal voting power.
In the following example, we first show all the nations'
present population in millions, then the number of representatives per
nation according to the Square-Root Method (with a minimum of 1
representative even for the smallest nations), and finally the "weighted" number
of delegates.
1. Eastern European Region
| Nr. | Country | Population in MIO |
Square- Root |
Reps. (weighted) |
| 1 | Russia | 141.9 | 12 | 10 |
| 2 | Turkey | 72.6 | 9 | 7 |
| 3 | Ukraine | 46.0 | 7 | 6 |
| 4 | Poland | 38.2 | 6 | 5 |
| 5 | Uzbekistan | 27.5 | 5 | 4 |
| 6 | Rumania | 21.5 | 5 | 4 |
| 7 | Kazakhstan | 15.8 | 4 | 3 |
| 8 | Czech Rep. | 10.5 | 3 | 3 |
| 9 | Hungary | 10.0 | 3 | 3 |
| 10 | Serbia | 9.9 | 3 | 3 |
| 11 | Belarus (White Russia) | 9.5 | 3 | 3 |
| 12 | Azerbaijan | 8.9 | 3 | 2 |
| 13 | Bulgaria | 7.6 | 3 | 2 |
| 14 | Tajikistan | 7.0 | 3 | 2 |
| 15 | Kyrgyzstan | 5.5 | 2 | 2 |
| 16 | Slovakia | 5.4 | 2 | 2 |
| 17 | Finland | 5.4 | 2 | 2 |
| 18 | Turkmenistan | 5.1 | 2 | 2 |
| 19 | Croatia | 4.4 | 2 | 2 |
| 20 | Georgia | 4.4 | 2 | 2 |
| 21 | Bosnia-Herzegovina | 3.8 | 2 | 2 |
| 22 | Moldavia | 3.6 | 2 | 2 |
| 23 | Lithuania | 3.3 | 2 | 2 |
| 24 | Albania | 3.2 | 2 | 1 |
| 25 | Latvia | 2.2 | 1 | 1 |
| 26 | Slovenia | 2.1 | 1 | 1 |
| 27 | Macedonia | 2.0 | 1 | 1 |
| 28 | Estonia | 1.3 | 1 | 1 |
| 29 | Montenegro | 0.6 | 1 | 1 |
| TOTAL | 479 | 94 | 81 |
2. Chino-Japanese Region
| Nr. | Country | Population in MIO |
Square- Root |
Reps. (weighted) |
| 30 | China | 1'337.5 | 37 | 45 |
| 31 | Japan | 127.4 | 11 | 14 |
| 32 | South Korea | 49.8 | 7 | 8 |
| 33 | North Korea | 24.1 | 5 | 6 |
| 34 | Taiwan | 23.1 | 5 | 6 |
| 35 | Mongolia | 2.8 | 2 | 2 |
| TOTAL | 1565 | 67 | 81 |
3. Pacific Region
| Nr. | Country | Population in MIO |
Square- Root |
Reps. (weighted) |
| 36 | Indonesia | 231.4 | 15 | 14 |
| 37 | Philippines | 92.2 | 10 | 9 |
| 38 | Vietnam | 85.8 | 9 | 9 |
| 39 | Thailand | 63.5 | 8 | 8 |
| 40 | Myanmar | 50.0 | 7 | 7 |
| 41 | Malaysia | 28.3 | 5 | 5 |
| 42 | Australia | 22.3 | 5 | 4 |
| 43 | Cambodia | 14.8 | 4 | 4 |
| 44 | Papua New Guinea | 6.7 | 3 | 2 |
| 45 | Laos | 6.3 | 3 | 2 |
| 46 | Singapore | 5.0 | 2 | 2 |
| 47 | New Zealand | 4.4 | 2 | 2 |
| 48 | East Timor | 1.1 | 1 | 1 |
| 49 | Fiji | 0.8 | 1 | 1 |
| 50 | Solomon Islands | 0.5 | 1 | 1 |
| 51 | Brunei | 0.4 | 1 | 1 |
| 52 | Vanuatu | 0.2 | 1 | 1 |
| 53 | Samoa West | 0.2 | 1 | 1 |
| 54 | Micronesia | 0.1 | 1 | 1 |
| 55 | Tonga | 0.1 | 1 | 1 |
| 56 | Kiribati | 0.1 | 1 | 1 |
| 57 | Marshall Islands | 0.1 | 1 | 1 |
| 58 | Belau (Palau) | 0.02 | 1 | 1 |
| 59 | Tuvalu | 0.01 | 1 | 1 |
| 60 | Nauru | 0.01 | 1 | 1 |
| TOTAL | 614 | 86 | 81 |
4. Western European Region
| Nr. | Country | Population in MIO |
Square- Root |
Reps. (weighted) |
| 61 | Germany | 81.8 | 9 | 10 |
| 62 | France | 65.4 | 8 | 9 |
| 63 | Great Britain | 62.0 | 8 | 8 |
| 64 | Italy | 60.3 | 8 | 8 |
| 65 | Spain | 46.0 | 7 | 7 |
| 66 | Netherlands | 16.6 | 4 | 4 |
| 67 | Greece | 11.3 | 3 | 4 |
| 68 | Belgium | 10.8 | 3 | 3 |
| 69 | Portugal | 10.6 | 3 | 3 |
| 70 | Sweden | 9.3 | 3 | 3 |
| 71 | Austria | 8.4 | 3 | 3 |
| 72 | Switzerland | 7.8 | 3 | 3 |
| 73 | Denmark | 5.5 | 2 | 3 |
| 74 | Norway | 4.9 | 2 | 2 |
| 75 | Ireland | 4.5 | 2 | 2 |
| 76 | Cyprus | 0.8 | 1 | 1 |
| 77 | Luxembourg | 0.5 | 1 | 1 |
| 78 | Malta | 0.4 | 1 | 1 |
| 79 | Iceland | 0.3 | 1 | 1 |
| 80 | Andorra | 0.1 | 1 | 1 |
| 81 | Liechtenstein | 0.04 | 1 | 1 |
| 82 | Monaco | 0.03 | 1 | 1 |
| 83 | San Marino | 0.03 | 1 | 1 |
| 84 | Holy Sea (Vatican City) | 0.001 | 1 | 1 |
| TOTAL | 407 | 77 | 81 |
5. North American Region
| Nr. | Country | Population in MIO |
Square- Root |
Reps. (weighted) |
| 85 | U.S.A. | 309.3 | 18 | 29 |
| 86 | Mexico | 107.6 | 10 | 17 |
| 87 | Canada | 34.1 | 6 | 10 |
| 88 | Guatemala | 14.0 | 4 | 6 |
| 89 | Honduras | 7.5 | 3 | 4 |
| 90 | El Salvador | 6.2 | 2 | 4 |
| 91 | Nicaragua | 5.7 | 2 | 4 |
| 92 | Costa Rica | 4.6 | 2 | 3 |
| 93 | Panama | 3.5 | 2 | 3 |
| 94 | Belize | 0.3 | 1 | 1 |
| TOTAL | 493 | 50 | 81 |
6. South American Region
| Nr. | Country | Population in MIO |
Square- Root |
Reps. (weighted) |
| 95 | Brazil | 192.9 | 14 | 15 |
| 96 | Columbia | 45.4 | 7 | 7 |
| 97 | Argentina | 40.1 | 6 | 7 |
| 98 | Peru | 29.1 | 5 | 6 |
| 99 | Venezuela | 28.8 | 5 | 6 |
| 100 | Chile | 17.1 | 4 | 5 |
| 101 | Ecuador | 14.2 | 4 | 4 |
| 102 | Cuba | 11.2 | 3 | 4 |
| 103 | Dominican Republic | 10.1 | 3 | 3 |
| 104 | Haiti | 10.1 | 3 | 3 |
| 105 | Bolivia | 9.9 | 3 | 3 |
| 106 | Paraguay | 6.3 | 3 | 3 |
| 107 | Uruguay | 3.4 | 2 | 2 |
| 108 | Jamaica | 2.7 | 2 | 2 |
| 109 | Trinidad and Tobago | 1.3 | 1 | 1 |
| 110 | Guyana | 0.8 | 1 | 1 |
| 111 | Surinam | 0.5 | 1 | 1 |
| 112 | Bahamas | 0.3 | 1 | 1 |
| 113 | Barbados | 0.3 | 1 | 1 |
| 114 | Saint Lucia | 0.2 | 1 | 1 |
| 115 | St. Vincent & Grenadines | 0.1 | 1 | 1 |
| 116 | Grenada | 0.1 | 1 | 1 |
| 117 | Antigua & Barbuda | 0.1 | 1 | 1 |
| 118 | Dominica | 0.1 | 1 | 1 |
| 119 | St. Kitts & Nevis | 0.1 | 1 | 1 |
| TOTAL | 425 | 75 | 81 |
7. Sub-Saharan Region
| Nr. | Country | Population in MIO |
Square- Root |
Reps. (weighted) |
| 120 | Nigeria | 154.7 | 12 | 6 |
| 121 | Ethiopia | 79.2 | 9 | 4 |
| 122 | Zaire | 66.0 | 8 | 4 |
| 123 | South Africa | 49.3 | 7 | 3 |
| 124 | Tanzania | 43.7 | 7 | 3 |
| 125 | Kenya | 39.8 | 6 | 3 |
| 126 | Sudan | 39.2 | 6 | 3 |
| 127 | Uganda | 32.7 | 6 | 2 |
| 128 | Ghana | 23.8 | 5 | 2 |
| 129 | Mozambique | 21.4 | 5 | 2 |
| 130 | Ivory Coast | 21.1 | 5 | 2 |
| 131 | Madagascar | 19.6 | 4 | 2 |
| 132 | Cameroon | 19.5 | 4 | 2 |
| 133 | Angola | 18.5 | 4 | 2 |
| 134 | Burkina Faso | 15.8 | 4 | 2 |
| 135 | Niger | 15.3 | 4 | 2 |
| 136 | Malawi | 15.3 | 4 | 2 |
| 137 | Mali | 14.5 | 4 | 2 |
| 138 | Zambia | 12.9 | 4 | 2 |
| 139 | Senegal | 12.5 | 4 | 2 |
| 140 | Zimbabwe | 12.5 | 4 | 2 |
| 141 | Chad | 11.3 | 3 | 1 |
| 142 | Guinea | 10.1 | 3 | 1 |
| 143 | Rwanda | 10.3 | 3 | 1 |
| 144 | Somalia | 9.1 | 3 | 1 |
| 145 | Benin | 8.9 | 3 | 1 |
| 146 | Burundi | 8.3 | 3 | 1 |
| 147 | Togo | 6.6 | 3 | 1 |
| 148 | Sierra Leone | 5.7 | 2 | 1 |
| 149 | Eritrea | 5.1 | 2 | 1 |
| 150 | Central African Republic | 4.4 | 2 | 1 |
| 151 | Congo, Rep. | 4.4 | 2 | 1 |
| 152 | Liberia | 3.5 | 2 | 1 |
| 153 | Mauritania | 3.3 | 2 | 1 |
| 154 | Namibia | 2.2 | 1 | 1 |
| 155 | Lesotho | 2.1 | 1 | 1 |
| 156 | Botswana | 2.0 | 1 | 1 |
| 157 | Gambia | 1.7 | 1 | 1 |
| 158 | Guinea-Bissau | 1.6 | 1 | 1 |
| 159 | Gabon | 1.5 | 1 | 1 |
| 160 | Mauritius | 1.3 | 1 | 1 |
| 161 | Swaziland | 1.2 | 1 | 1 |
| 162 | Djibouti | 0.9 | 1 | 1 |
| 163 | Comoros | 0.7 | 1 | 1 |
| 164 | Equatorial Guinea | 0.7 | 1 | 1 |
| 165 | Cape Verde | 0.5 | 1 | 1 |
| 166 | Sao Tome & Principe | 0.2 | 1 | 1 |
| 167 | Seychelles | 0.1 | 1 | 1 |
| TOTAL | 835 | 163 | 81 |
8. Arabo-Persian Region
| Nr. | Country | Population in MIO |
Square- Root |
Reps. (weighted) |
| 168 | Pakistan | 169.5 | 13 | 12 |
| 169 | Egypt | 78.3 | 9 | 8 |
| 170 | Iran | 74.2 | 9 | 8 |
| 171 | Algeria | 34.9 | 6 | 5 |
| 172 | Morocco | 31.8 | 6 | 5 |
| 173 | Iraq | 30.7 | 6 | 5 |
| 174 | Afghanistan | 28.2 | 5 | 5 |
| 175 | Saudi Arabia | 25.7 | 5 | 5 |
| 176 | Yemen | 23.6 | 5 | 4 |
| 177 | Syria | 21.9 | 5 | 4 |
| 178 | Tunisia | 10.4 | 3 | 3 |
| 179 | Israel | 7.5 | 3 | 2 |
| 180 | Libya | 6.4 | 3 | 2 |
| 181 | Jordan | 6.3 | 3 | 2 |
| 182 | United Arab Emirates | 4.6 | 2 | 2 |
| 183 | Lebanon | 4.3 | 2 | 2 |
| 184 | Armenia | 3.2 | 2 | 2 |
| 185 | Kuwait | 3.0 | 2 | 2 |
| 186 | Oman | 2.8 | 2 | 1 |
| 187 | Qatar | 1.4 | 1 | 1 |
| 188 | Bahrain | 0.8 | 1 | 1 |
| TOTAL | 570 | 93 | 81 |
9. Indian Region
| Nr. | Country | Population in MIO |
Square- Root |
Reps. (weighted) |
| 189 | India | 1'180.8 | 34 | 48 |
| 190 | Bangladesh | 162.2 | 13 | 18 |
| 191 | Nepal | 29.3 | 5 | 7 |
| 192 | Sri Lanka | 20.2 | 4 | 6 |
| 193 | Bhutan | 0.7 | 1 | 1 |
| 194 | Maldives | 0.3 | 1 | 1 |
| TOTAL | 1394 | 58 | 81 |
Recapitulation:
| Region / Group | Population in MIO |
Total of Square- Roots |
Total Number of Reps. (weighted) |
| Eastern European Region
Chino-Japanese Region Pacific Region Group "East" |
479 |
94 |
81 |
| Western European Region North American Region South American Region Group "West" |
407 |
77 |
81 |
| Sub-Saharan Region
Arabo-Persian Region Indian Region Group "South" |
835 |
163 |
81 |
|
GRAND TOTAL: |
6'782 |
763 |
729 |
The total of 729 Representatives would remain unchanged for all times, irrespective of the future development of world population. Equally, the total of 81 Representatives per Group would remain unchanged. However, within each group, the relative strength in population of each nation can be taken into account periodically, and the respective numbers of Representatives per nation adjusted accordingly.
At this stage, nobody can predict how the peoples of the world will one day decide as to the way they want to be represented in a World Parliament-to-be. The discussion is open, and every individual world citizen is invited to have his or her own go at the "numbers game". It is both fascinating and entertaining - and an excellent example of democracy at work. The end-result of the game will one day decide how democratic, and peaceful, our world will be.
Attachments (please click on the links):
-
Calculation of "adjusted"
numbers of Representatives (with explanations, in German)
- Examples of possible
voting procedure within the relative weight of voting blocks
*
* * ![]() *
* *
*
* *
PS: Within the United Nations, five "regional groups" have been established for electoral purposes. These groups are:
1) Eastern European Countries: with 23 nations
2) Asian Group (including Middle East, South East Asia, Pacific Islands): 53
nations
3) Western European Countries, North America, Australia, New Zealand: 29 nations
4) Latin American and Caribbean Countries: 33 nations
5) African Countries (including North Africa): 53 nations
In 2000, in a statement by H.E. Vinci N. Clodumar, the Republic of Nauru suggested the establishment of a new group called "Oceania", which would include not only the Pacific Island nations, but also Australia, New Zealand, ASEAN countries, Japan, and South Korea.
The concept of nine world regions could be varied in many ways. There is in fact a strong argument to include Japan and the Koreas in the Pacific region rather then in the Chinese/Mongolian region; Panama might be relocated in the South American region; Western Sahara might be considered part of the Sub-Saharan region.
.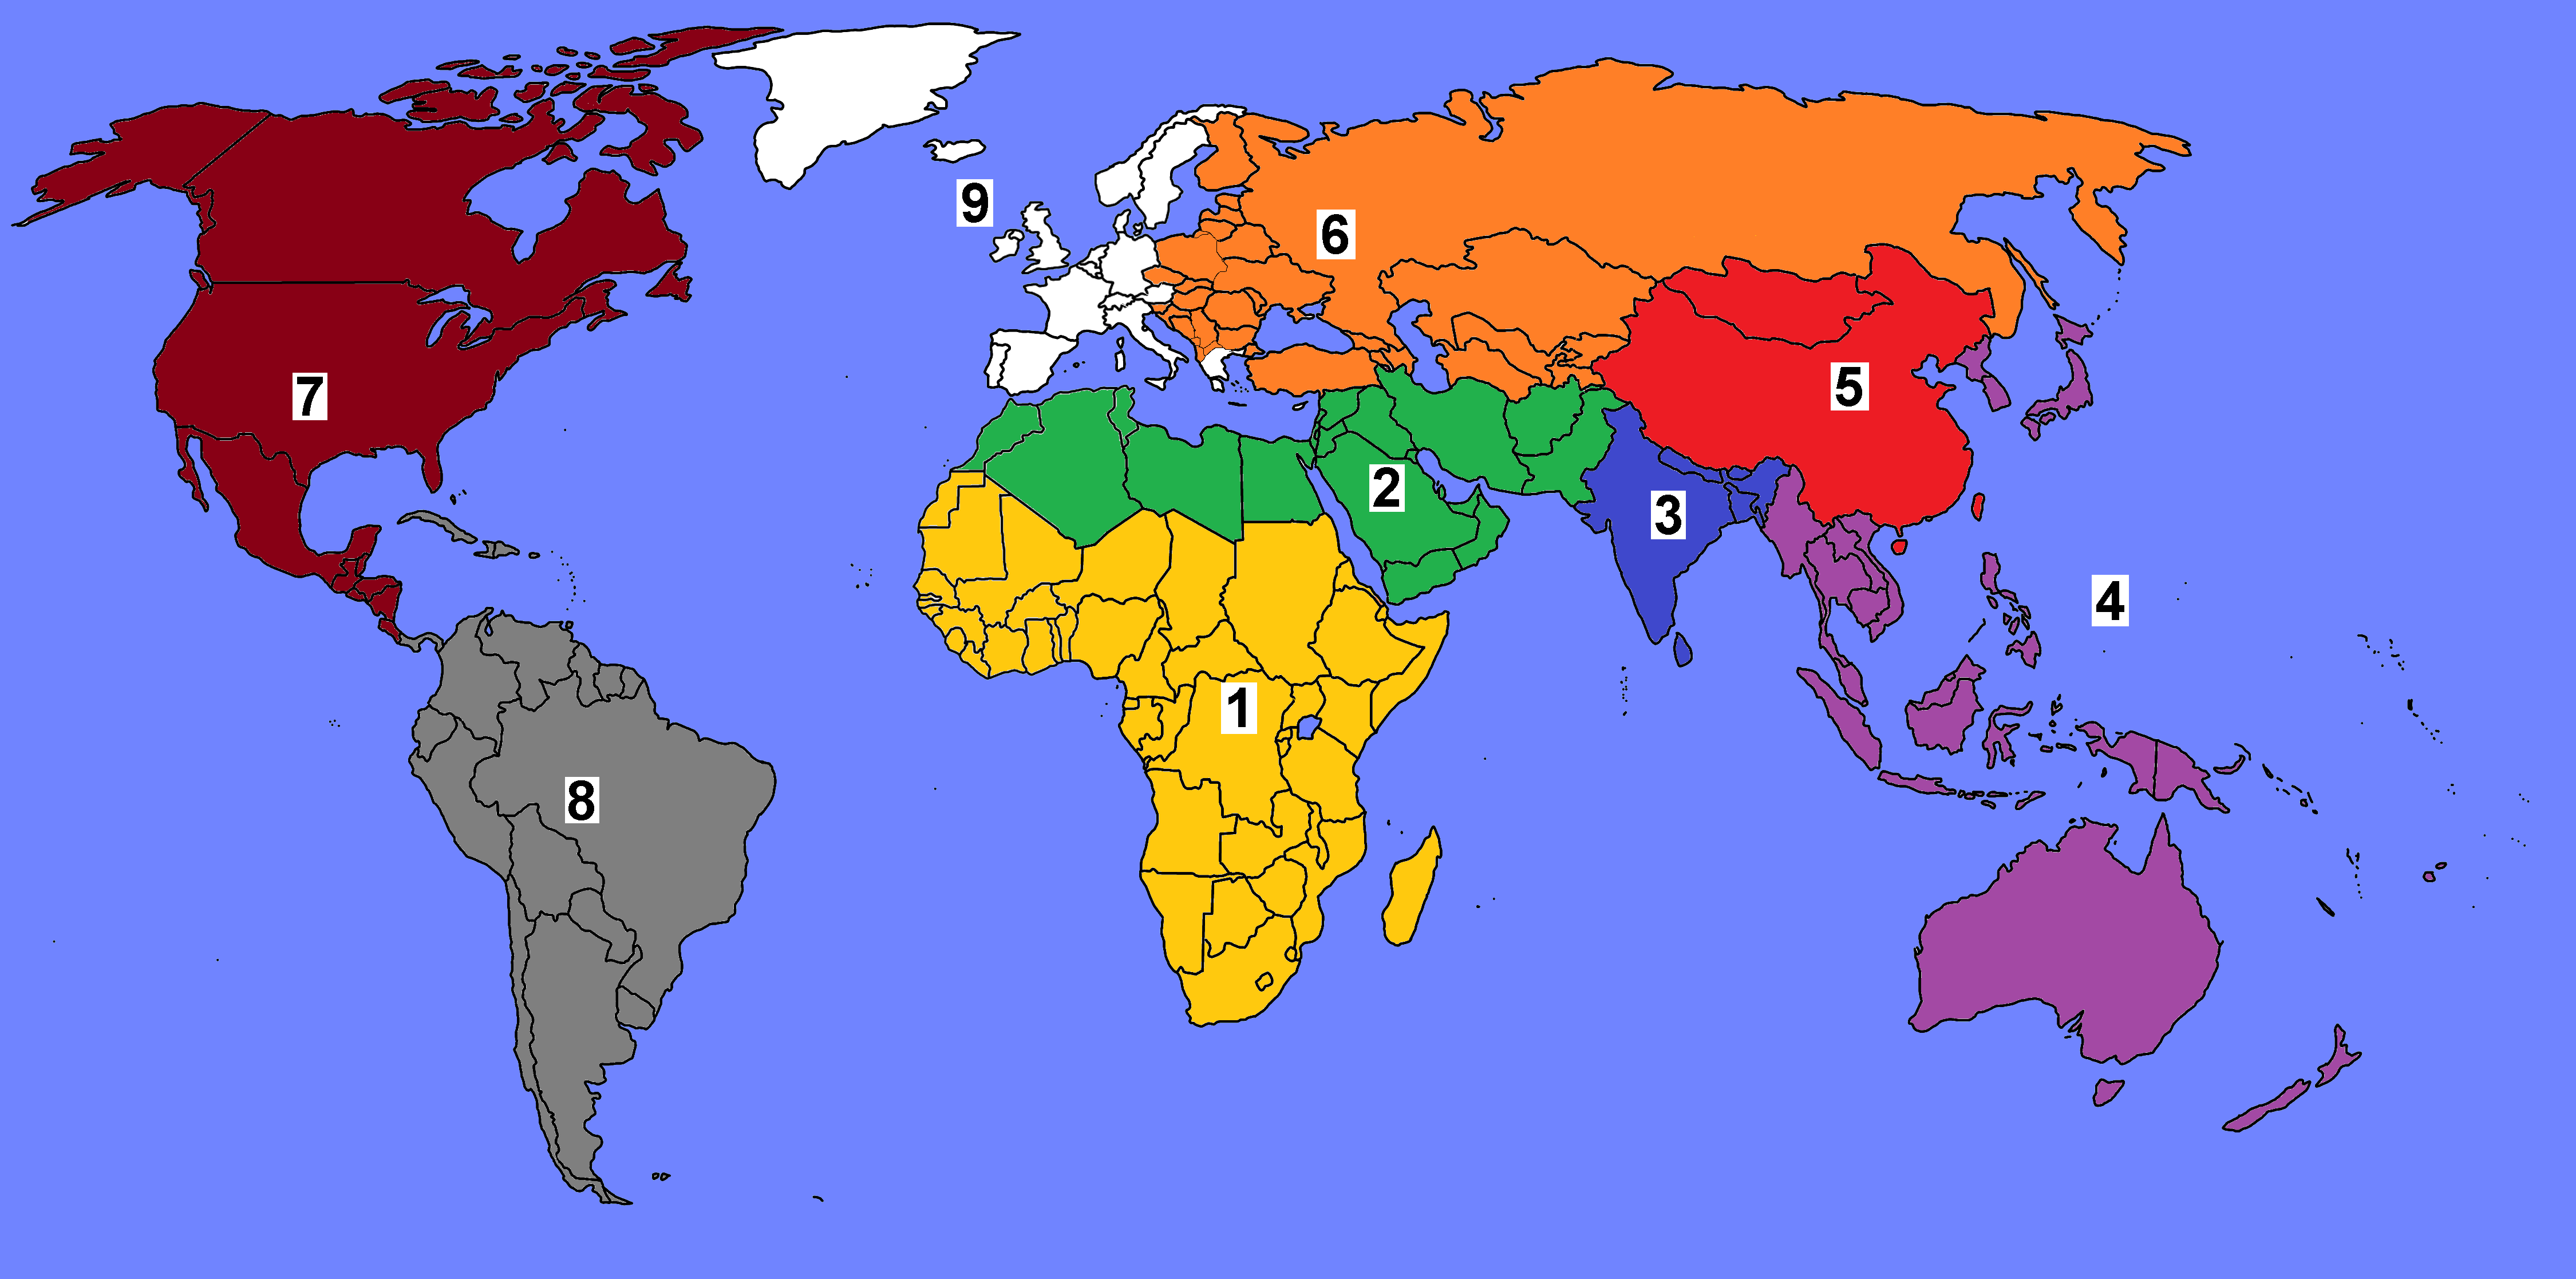
Possible distribution of the proposed nine world regions.
For a new calculation, including the introduction of three sub-regions each, click here.
Original text written by Peter Kasser in autumn 1999,
published in the internet on
13th January 2000
Latest update (with newest population numbers, new
groupings, and attachments for the calculation of "adjusted" representatives,
and a voting example):
May 2010